 I’ve said from the very beginning that Analytics is your most valuable marketing activity. So I hope that everyone reading this is now looking at some form of metrics for your web site. But even after you’ve chosen relevant Key Performance Indicators and have an easy to understand Scorecard for your site, there is so much data available to you that you are probably having troubles drawing strong conclusions from the data you see.
Trouble, that is, if you’re not using the most powerful of all tools in your Analytics toolbox—Customer Segmentation. Customer segments are your key to unlock huge revelations about your site’s visitors.
The Importance of Segmentation in Web Analytics
The total sum of all metrics available for your site is typically so large that it is difficult to draw many conclusions at all, let alone gain valuable insight. But that data is made up of thousands of visits coming from dozens of sources, conducting hundreds of transactions, and viewing tens of thousands of pages. In the end, all of those numbers tend to average out in aggregate. But when broken in to smaller groups, you can start to see where improvements can be made.
Think of yourself as the manager of a baseball team of 25 players. As a whole, your team might hit about average, hit slightly less than average home runs, and have slightly better than average pitching. But as the coach, you pay much closer attention to what each individual player does well or poorly. Your pitchers might be better than average as a whole because of one or two strong starters, but you might have a poor relief staff that blows leads. So you focus on improving them.
Your best home run hitters might not be regulars due to being poor fielders. If you could improve their fielding, they could play more and your team would have more power. Perhaps you notice that one player has a hitch in his swing, which if corrected could improve his hitting tremendously.
But if all you had looked at was your team’s totals, you would probably miss most of this.
Now think of your aggregate metrics as your team’s totals. But grouping things into segments yields the same kind of insight as looking at each player individually. Perhaps your site’s overall conversion rate is 2%, but for those who come from paid search ads, the conversion rate might be 5%. You might want to increase your ad spend.
Maybe those using a smart phone converted less than half as often as those on a desktop. You might want to isolate what makes your site more difficult to use on a phone. Perhaps people who see one particular page end up signing up for your newsletter three times as often as those who do not see that page. Find ways to funnel more people to that key page.
How Do You Find This Great Insight?
Most analytics tools have segmentation methods readily available. Since Google Analytics is so widely adopted and freely available, I’ll use that for these examples. But you can mimic these examples in nearly any analytics software currently available.
Creating or applying a user segment in your analytics program essentially means filtering out all data around dimensions that do not meet a certain criteria. You could create a segment of just the visitors who converted, or just the visitors who came from paid ads, for example. Then you can apply one or more segments and see how their numbers differ from the aggregate, or from other segments, to start to learn more.
Google Analytics comes pre-populated with several segments already, and also gives you the ability to create as many more as you like. As of this writing, up toward the very top-left of the screen is a link for “Advanced Segments”. Clicking that link brings up a list of a dozen or so pre-defined segments, such as New Visitor, Returning Visitors, Paid Search Traffic, Non-Paid Search Traffic, All Search Traffic, etc. Many of these segments can be rather enlightening on their own and are a good place to get your feet wet.
Custom Segments
As you segment your data more and more, you’ll quickly want to do things not available with the Default Segments Google provides. That’s where their Custom Segments come in to play. To begin to see the range of segmenting options available, click the “+ New Custom Segment” button at the bottom-right of the Segments section. Here you’ll see well over 100 different dimensions, metrics and variables you can use around which to create segments.
Now you can start to create compound segments such as Returning Mobile Visitors that Did Not Bounce, or Internet Explorer Visitors that Looked at More Than 5 Pages.
Do those seem kind of random? Here are some examples of some very useful segments, and how they can be used to gain valuable insight to improve your site’s results.
Mobile vs. Non-Mobile Traffic
This seems pretty mundane on the surface. Many people probably use the built-in report that shows total visits by mobile vs. non-mobile, but don’t take too much away from it other than the fact that it proves mobile usage is growing. Duh! We all already knew that!
But how well are mobile users converting on your site compared to non-mobile users? And what’s that worth to you? In a post earlier this month I gave an example, based on a real situation, that allowed the owner to estimate how much a poor mobile experience was costing the company. Simply look at the difference of conversion rate times average order value for each segment (mobile vs. non-mobile) times the average number of mobile users per month, and you can have an estimate of the cost of a poor mobile experience. This can help you determine whether to make a responsive redesign be an urgent priority, or something to plan out over the next 12 months.
Mobile Traffic is one of the default segments in Google Analytics. You can create a custom segment to Exclude Mobile Traffic.

Mobile Traffic Excluding Tablets
By default, the mobile segments in Google Analytics include traffic from tablets such as the iPad. That’s all well and good, but with the primary exception of a tablet’s use of a touch-screen, the user experience on a tablet is very similar to that of a laptop or desktop. The most common mobile usability issues come up with smart phones or devices with smaller screens. Very often, when analyzing mobile traffic, I screen out tablet visits.
To do this, you could set up a segment that includes all Mobile (including Tablet) and add AND statements that exclude each tablet device (or set up a RegEx to do that exclude in one statement). However, this forces you to keep up with changes in the tablet world. I prefer a segment offered up by Angie Schottmuller of Three Deep Marketing—”Screen Max Width 599″.
This shows you, regardless of device, just the visits with less than 600 pixel screen size. This gets us much more to what we are looking for.
To set up this segment, Include Screen Resolution Matching RegExp of:
(^[1-5]?[0-9]?[0-9])x([1-5]?[0-9]?[0-9]$)
Visits With Site Search
It’s no secret that for ecommerce sites, visits where the customer uses the site search tend to convert at a much higher rate than those without. How well does your site do for sessions where the visitor uses your search? If it’s not much different than for those without, perhaps you should improve your site search function. If your site does convert at a much higher rate in visits where search is used, consider making your search bar more prominent to get more people to use it.
There’s no one-size-fits-all segmentation scheme to achieve this. However, the easiest way is to see what the page name(s) used in your site’s search function, and then set your segment up to Include Page Containing that page (or pages).

This example assumes that /sitesearch.asp is the page for your site search.
Blog-To-Website Visits
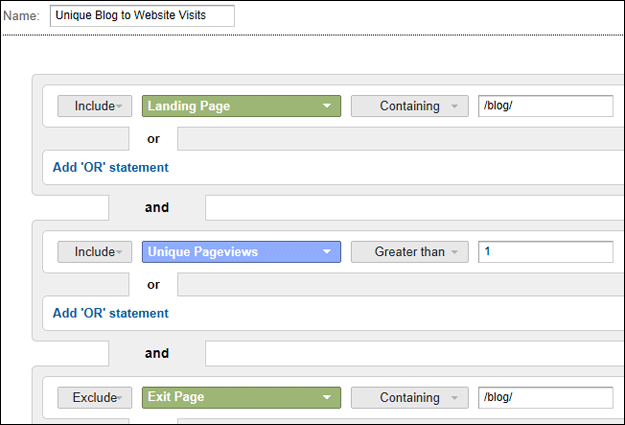
For many of you, your blog is your site, but for many others, your blog is used as one method of acquiring traffic, with the hopes that your blog readers will check out other sections of your site, and hopefully become a customer. This segment, provided by Graham Charlton of Econsultancy, focuses just on those visits—visits where the landing page was part of your blog, but where the visitor also looked at at least one page in a different section.
To set up this segment, Include Landing Page Containing /blog/ (or whatever folder you have called your blog on your website), AND Include Unique Pageviews Greater Than 1, AND Exclude Exit Page Containing /blog/ (or again, whatever you have called your blog’s folder).
Use this segment to analyze how these visitors differ from your other blog visitors. Are they new or returning visitors? What sources/keywords did they come from? What are the landing pages they are entering through? It could be that one or two particular blog posts are driving the majority of this type of traffic. That will give you ideas on what kind of content to create going forward, and what kind of content to promote most.
Non-Bounce Visits
Whether your site’s Bounce Rate is high or low, analyzing what is causing bounces is generally done on a page-by-page basis. But how well is your site doing for those that it does succeed in engaging from the start? To find out, segment on just those visitors who do not bounce.
To set that up, simply Include Pageviews Greater Than 1.
Now you can start to isolate potential usability problems and other issues that hinder the users that actually do stick around a little while.
New Site Visitors Who Returned Within X Days
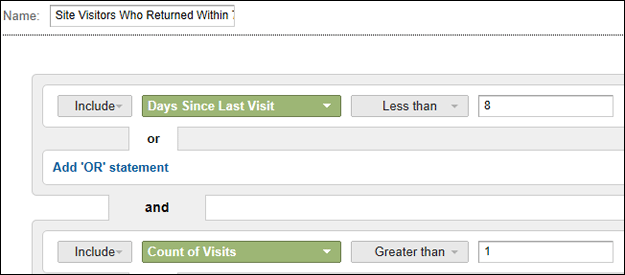
This segment comes from Pritesh Patel of Pauley Creative. Many look at “engagement” in terms of things like how long was your average visit, how many pages did people read, etc.—all single-session metrics. But in many cases, how well a site engages is best measured by how soon someone returns to the site.
To set it up, Include Days Since Last Visit Less Than X (for example, 7), AND Include Count Of Visits Greater Than 1. Pritesh credited Avinash Krausik as calling it “trying to reduce your one night stands.”
This is great for businesses with a consultative sales strategy or with long sales lead times, and good for lead generation sites as well. You can use it simply as a goal, as in to increase the percentage of these visitors to your total visitors. You can also use it to isolate what sources these visitors are coming from and what content they’re consuming. You can then invest more heavily in those areas to achieve better results.
Converters By Count of Visit
Josh Braaten of Rasmussen College is one person who has mentioned this segment. If yours is an ecommerce site (and set up as such in Google Analytics), then you can already see a report of “Visits to Transaction”, but you have to go into Advanced Segments to see data just for a certain group.
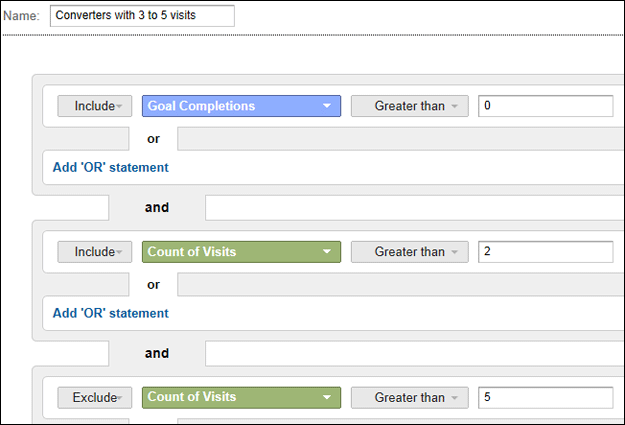
You must first have one or more goals set up in your GA profile to use this segment (otherwise, we don’t know who has converted and who has not). Then, if you want a segment of converters who visited between 3 and 5 times, set it up to Include Goal Completions Greater than 0 AND Include Count of Visits Greater Than 2 AND Exclude Count of Visits Greater Than 5. Obviously, you can change the numbers around (Goal Completions would always remain at Greater Than 0) to adjust your range of visits.
Do a large percentage of your conversions occur on the 2nd, 3rd, 4th visit, or even later? What kinds of content are these visitors looking at during their various trips to your site? How does this compare to those that do not compare at all? Now you have clues as to what kinds of content to focus your efforts on.
And Of Course
I feel remiss if I don’t rebroadcast some of the fantastic segmentation suggestions that Avinash Kaushik has offered up over the years. But that’s just it—there are far too many. Avinash is a true pioneer in the world of web analytics and turning them into actionable analysis. Your time is well spent to head on over to his blog, Occam’s Razor, and start looking through it. To jump start you, start with this post from May of 2010. But follow the links contained therein to other posts of his that will result in true nuggets of golden insight for you.
Finally
These segments are just the tip of the iceberg, food for thought to get your own creative juices flowing. The key is to think about your business and what you want your site’s visitors to be doing, and how you expect to influence them to do that. Then it’s a matter of trial and error to carve up the data into segments that can help you answer those questions.


Pingback: 10 Conversion Tips From "The Live Event" by Which Test Won - Tom Bowen's Blog - Web Site Optimizers()